EngineRoom — MarTech
EngineRoom offers a unique business model to SMEs looking to maximise sustainable growth through integrated analytics and business intelligence.
Winner 2020 AFR FAST 100 (formerly known as Digital360).
Product Designer
Aug 2018 - Feb 2022
EngineRoom combines market-leading technology with business advisory and digital experience to help customers unlock their full potential for growth. EngineRoom builds a bespoke mar-tech product that aggregates and transforms typically independent data sources. I joined the team in 2018 as the sole product designer. During my time, we made huge strides in providing a better experience, more value and a better return to the business. We’ve revamped the whole platform almost twice, including a major rebrand that I helped lead across the entire company.

Case Study
Re-imagining data visualisation to improve readability and reduce frustration moments.
Overview
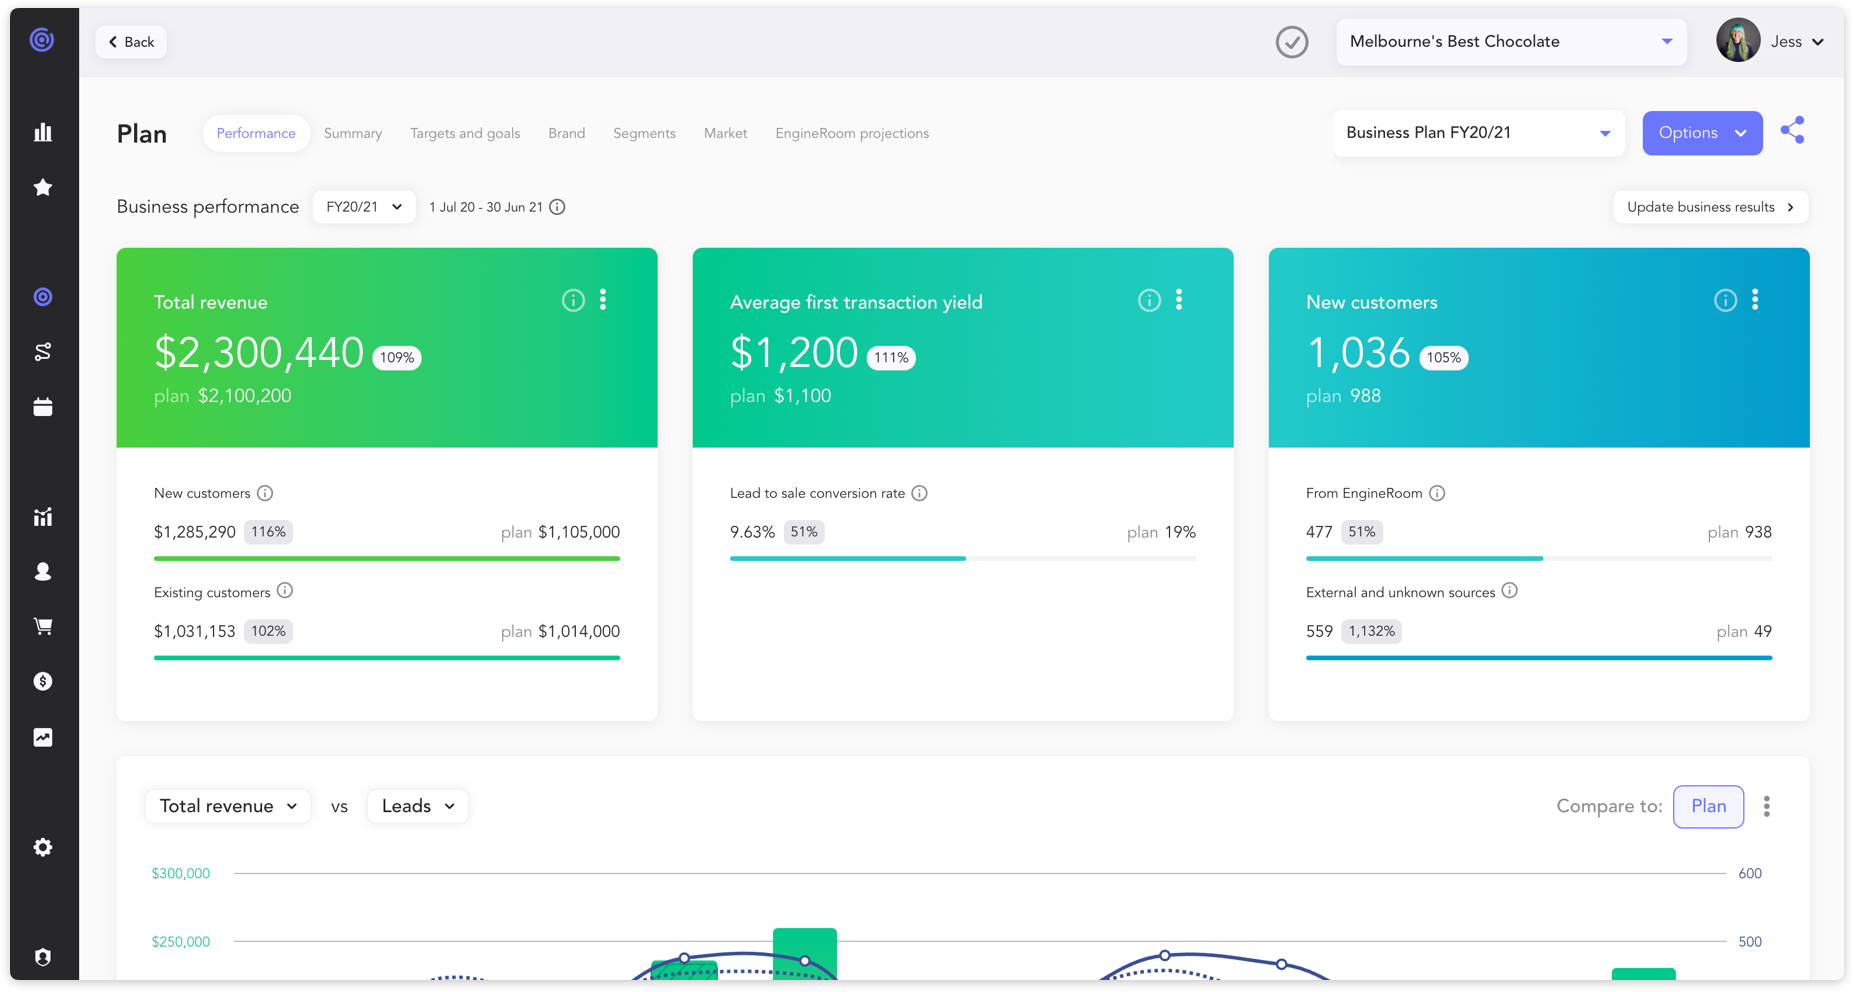
As a product that aggregates, combines and communicates data, EngineRoom has an important business need for the data to be communicated effectively and with ease. Our customers need this information to make strategy business decisions regarding hiring, expansion and budgets. This project aimed to improve our overall data strategy to support these needs.
Outcome
Not only did this project result in a significant release to our data visualisation experience and design, but it also led to the beginning foundation of our data display strategy — the foundation for how we display and communicate data inside EngineRoom. The strategy provides explanations and visual references that support understanding the current structure as well as tools for extending the strategy in the future.
My role
Lead and manage end-to-end process
Research
Wireframes
Prototypes
Usability Testing
UI Design
My team
Data Scientist
Software Engineer
Project Manager
Timeline
2 months (phase 2 — Q3 2021)


Hypothesis
If data is easier to understand, users are more likely to feel confident to take action and communicate insights to their teams.
Project Approach
Discovery: Research, Stakeholder interviews, competitor research
Ideation: Bold ideas, quick iteration, collaboration with data and engineering
Prototypes and usability: Exploring pain points and failing fast to iterate
High-fidelity design: Polish and refine
Launch and learn: Review product analytics and understand successive iteration

Data Display Strategy
Following our project launch, I took the initiative to work towards building out the framework for how, why and when certain types of visualisations and styles are used to communicate information. This was the early days and first iteration of our first attempt at a Data Display Strategy.


